


 40 / 330

33
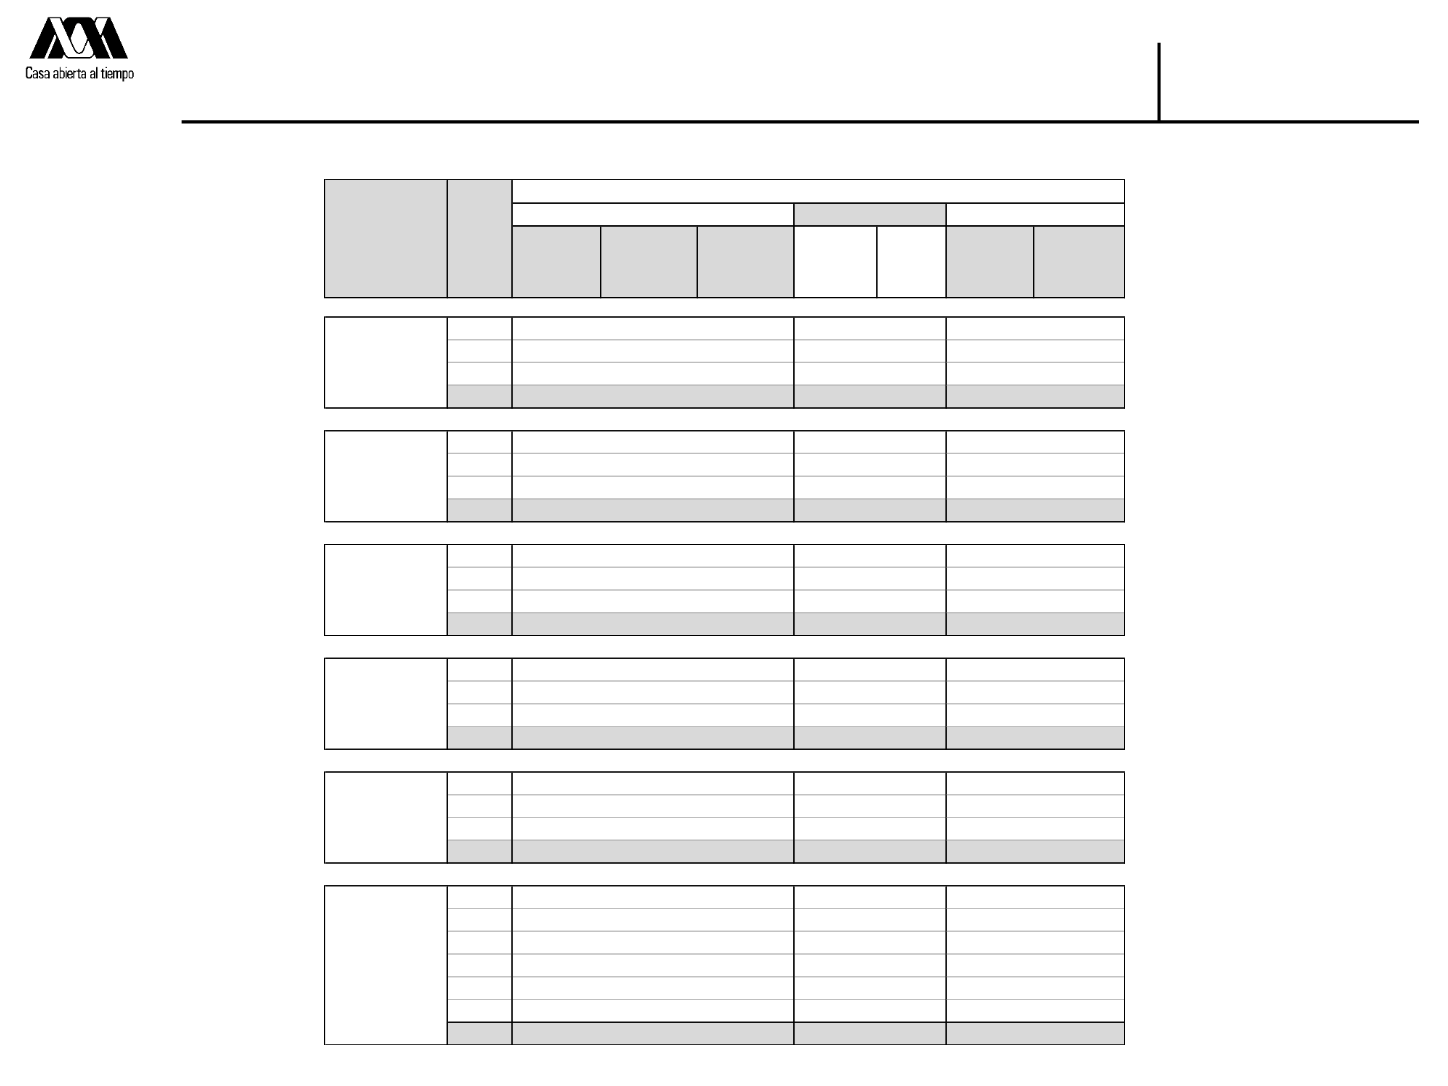
Resumen del primero y el segundo procesos de selección
Ingreso otoño
Licenciatura
Admitidos y
no admitidos
CBI
8,070
477
7,593
6,623
87.2%
970
12.8%
CSH
8,613
382
8,231
7,335
89.1%
896
10.9%
CAD
5,719
218
5,501
5,077
92.3%
424
7.7%
TOTAL
22,402
1,077
21,325 19,035
89.3%
2,290
10.7%
CSH
1,669
97
1,572
1,411
89.8%
161
10.2%
CCD
1,996
130
1,866
1,615
86.5%
251
13.5%
CNI
1,067
62
1,005
695
69.2%
310
30.8%
TOTAL
4,732
289
4,443
3,721
83.7%
722
16.3%
CBI
4,214
235
3,979
3,039
76.4%
940
23.6%
CSH
6,984
306
6,678
5,492
82.2%
1,186
17.8%
CBS
2,350
93
2,257
1,770
78.4%
487
21.6%
TOTAL
13,548
634
12,914 10,301
79.8%
2,613
20.2%
CBI
69
6
63
20
31.7%
43
68.3%
CSH
454
39
415
342
82.4%
73
17.6%
CBS
185
14
171
105
61.4%
66
38.6%
TOTAL
708
59
649
467
72.0%
182
28.0%
CSH
8,101
432
7,669
6,707
87.5%
962
12.5%
CBS
18,599
1,098
17,501 16,281
93.0%
1,220
7.0%
CAD
4,862
202
4,660
4,207
90.3%
453
9.7%
TOTAL
31,562
1,732
29,830 27,195
91.2%
2,635
8.8%
CBI
12,353
718
11,635
9,682 83.2% 1,953
16.8%
CSH 25,821
1,256
24,565 21,287 86.7% 3,278
13.3%
CBS
21,134
1,205
19,929 18,156 91.1% 1,773
8.9%
CAD 10,581
420
10,161
9,284 91.4% 877
8.6%
CCD
1,996
130
1,866
1,615 86.5% 251
13.5%
CNI
1,067
62
1,005
695 69.2% 310
30.8%
TOTAL
72,952
3,791
69,161 60,719
87.8%
8,442
12.2%
Admitidos
Tasa de
aceptación
Registrados
No
presentaron
el examen
Presentaron
examen
No
admitidos
Tasa de
rechazo
TOTAL DE INGRESO AL TRIMESTRES DE OTOÑO 2016
ASPIRANTES
NO ADMITIDOS
ADMITIDOS
UAM
CUAJIMALPA
IZTAPALAPA
XOCHIMILCO
LERMA
AZCAPOTZALCO
UNIDAD
DIVISIÓN