


 72 / 342

64
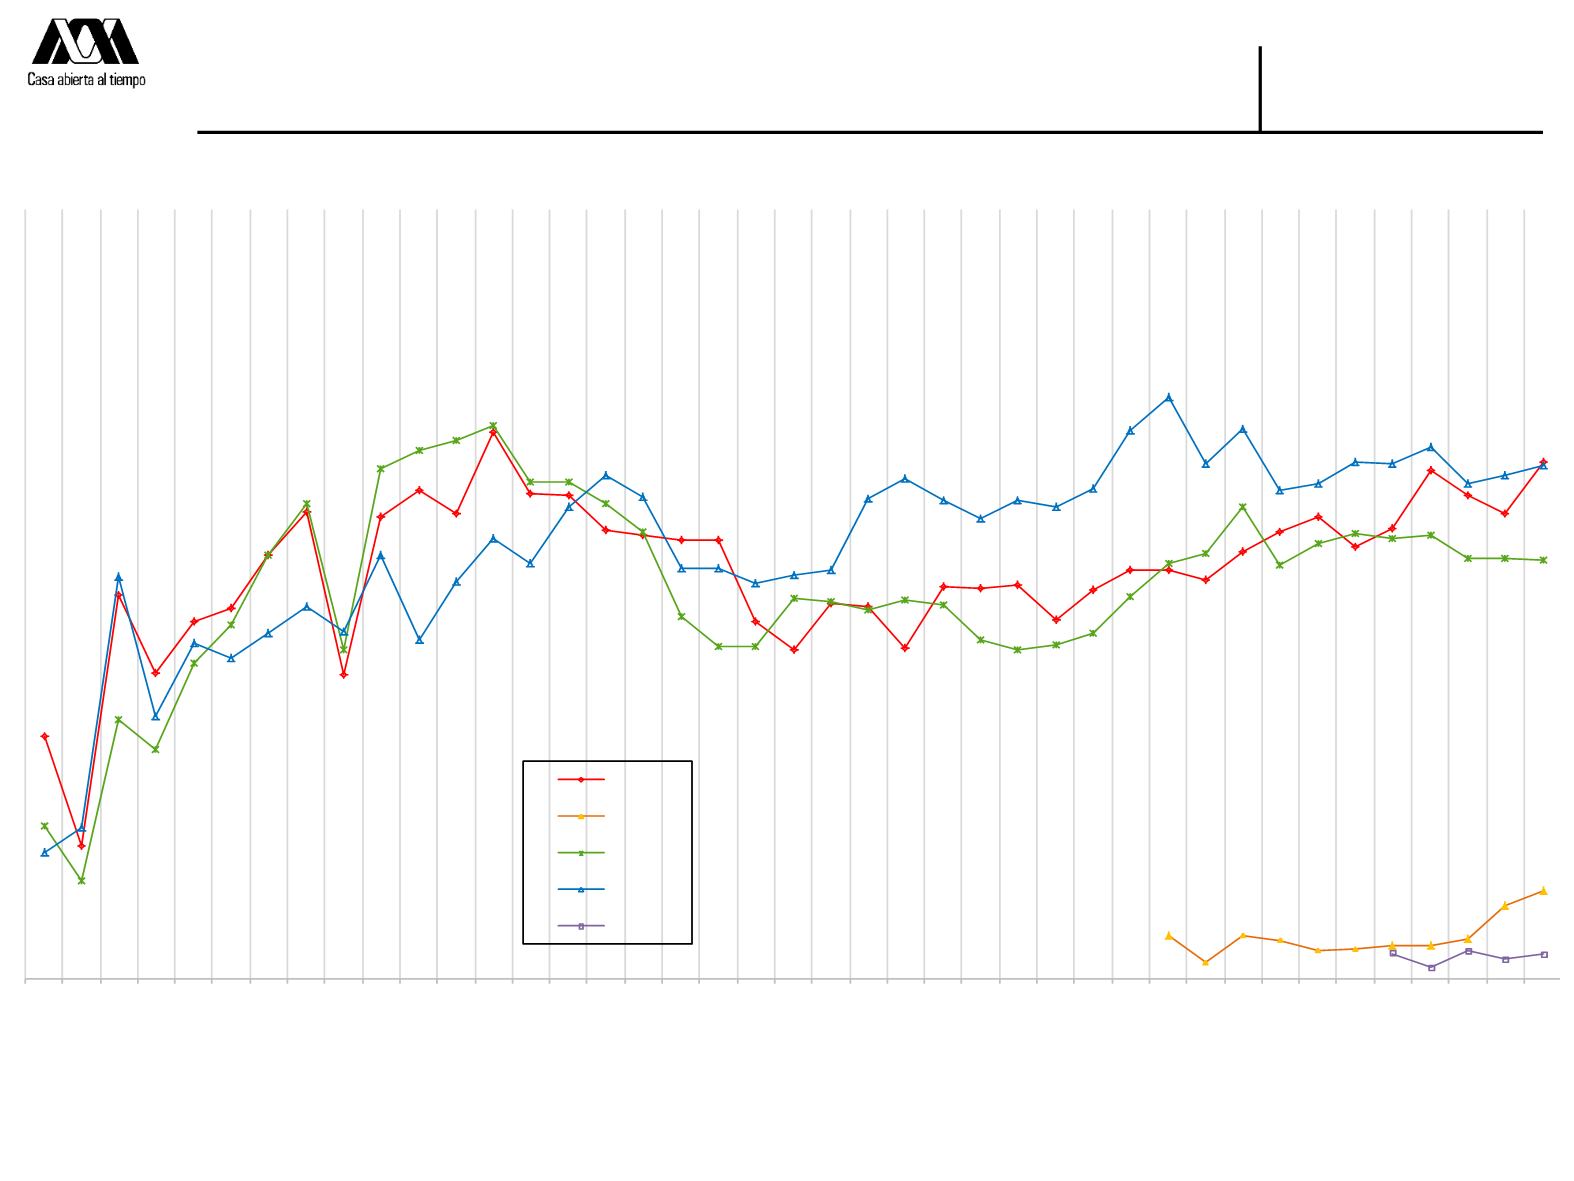
Comparativo de admitidos por División
Ciencias Sociales y Humanidades
1975-2015
Licenciatura
Admitidos y
no admitidos
757
414
1,197
954
1,115
1,158
1,325
1,457
952
1,443
1,524
1,451
1,708
1,515
1,508
1,401
1,387
1,368
1,370
1,115
1,027
1,174
1,161
1,034
1,225
1,220
1,229
1,120
1,216
1,277
1,275
1,248
1,334
1,397
1,442
1,349
1,405
1,586
1,512
1,454
1,616
134
52
137
122
90
94
105
106
123
227
275
480
308
811
719
984
1,105
1,323
1,485
1,027
1,593
1,648
1,679
1,729
1,550
1,550
1,485
1,395
1,129
1,039
1,038
1,188
1,176
1,150
1,182
1,166
1,058
1,030
1,044
1,080
1,195
1,299
1,328
1,474
1,291
1,361
1,392
1,375
1,385
1,312
1,315
1,306
395
471
1,257
821
1,050
1,003
1,079
1,162
1,087
1,325
1,061
1,240
1,375
1,296
1,476
1,573
1,506
1,280
1,280
1,234
1,263
1,277
1,500
1,560
1,495
1,436
1,493
1,472
1,533
1,711
1,817
1,611
1,716
1,524
1,546
1,616
1,611
1,663
1,547
1,572
1,606
81
37
88
65 76
1975
1976
1977
1978
1979
1980
1981
1982
1983
1984
1985
1986
1987
1988
1989
1990
1991
1992
1993
1994
1995
1996
1997
1998
1999
2000
2001
2002
2003
2004
2005
2006
2007
2008
2009
2010
2011
2102
2013
2014
2015
CSH-A
CSH-C
CSH-I
CSH-X
CSH-L