
65
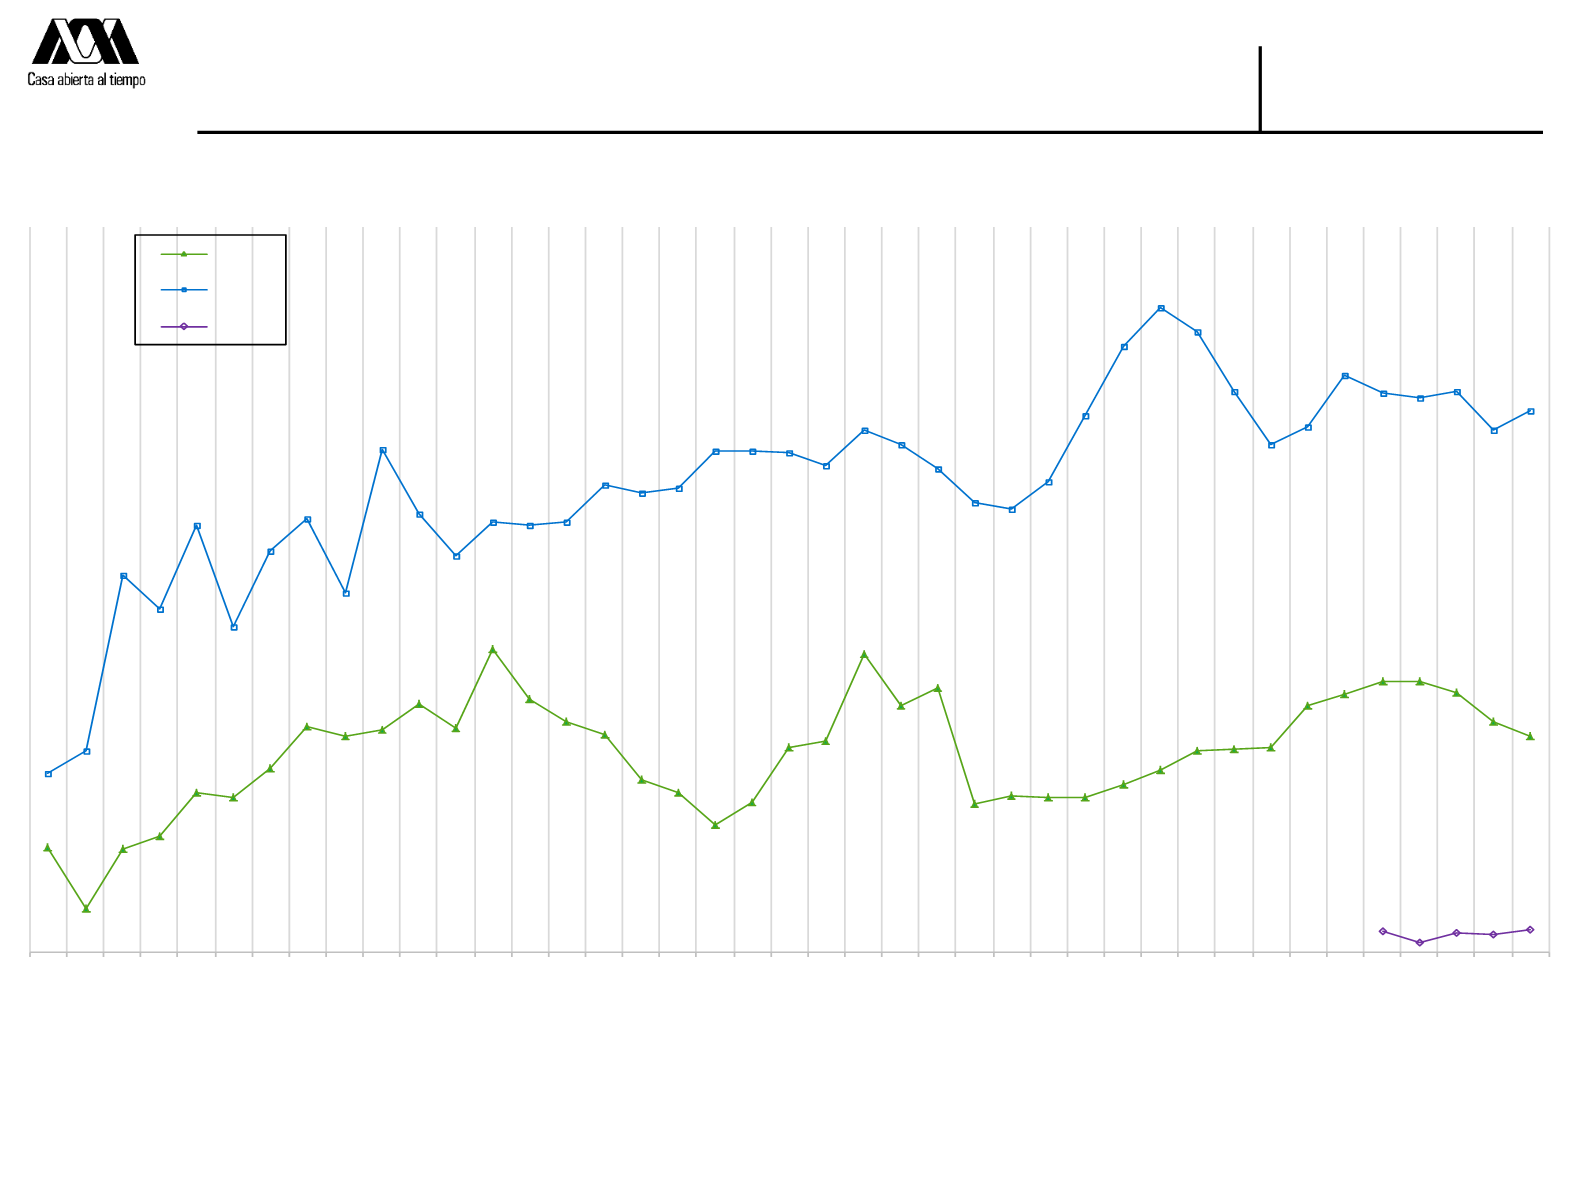
Comparativo de admitidos por División
Ciencias Biológicas y de la Salud
1975-2015
Licenciatura
Admitidos y
no admitidos
392
160
386
430
592
578
685
840
807
827
925
833
1,130
944
859
808
642
592
473
556
761
789
1,111
919
984
554
583
574
579
626
681
753
757
762
919
958
1006
1006
968
861
805
668
750
1,408
1,281
1,593
1,215
1,494
1,614
1,340
1,872
1,636
1,475
1,603
1,589
1,606
1,740
1,711
1,729
1,870
1,866
1,862
1,811
1,943
1,894
1,804
1,676
1,650
1,752
2,001
2,259
2,405
2,311
2,092
1,894
1,957
2,150
2,081
2,067
2,087
1,944
2,018
80
38
73 66 85
1975
1976
1977
1978
1979
1980
1981
1982
1983
1984
1985
1986
1987
1988
1989
1990
1991
1992
1993
1994
1995
1996
1997
1998
1999
2000
2001
2002
2003
2004
2005
2006
2007
2008
2009
2010
2011
2012
2013
2014
2015
CBS-I
CBS-X
CBS-L


